Election Machine Vendor Contract Analysis (Part 1 of 2)
26 Counties and 3 State Analysis
Introduction
This is part 1 of a 2 part series.
Did you ever want to spend hours staring at contracts between governmental bodies and election machine vendors? Me neither….but that is what I did with 26 counties and 3 states that between them, have contracts with 4 different election machine vendors.
For the purpose of these two articles, I am not going to name the jurisdictions or the vendors. The actual contracts (which are public) can be made available on a case by case basis.
First, this analysis is focused on contract cost…..NOT contract terms and conditions. The cost I am focused on is ONLY the line items in the contracts themselves. For example, I am not dealing with the cost of voting convenience centers and the staff to run them, etc. The total cost of running elections is far greater than what I am presenting here.
Second, in this first article, I will simply present the TOTAL contract value analysis. Each contract is unique. Some involve no warranty, other 8 years of warranty. Some include professional services, others do not.
Third, one of the most challenging aspects of this analysis was normalizing the contract line items by cost type. Extracting the data from scanned pdf’s was no vacation, but, after that, in order to present a coherent analysis, the method I choose to use was to apply a finite list of “cost type” parameters.
What do I mean by “cost type”?
Here is an example of the exact contract product: ImageCast X Pollworker Smartcards
Here is my classification of that product.
Year: 2018
Jurisdiction: County07
Type: Hardware
Standard Description: Memory Device
Cost Type: One Time
Units: 80
Unit Cost: $8
Price: $640
There are 1,047 individual contract items extracts from all 29 contracts and each one was normalized in this way. Below are the possible values of the classification.
Year: 2014 through 2029
Jurisdiction: County 01 through County26, State01, State02 and State 03.
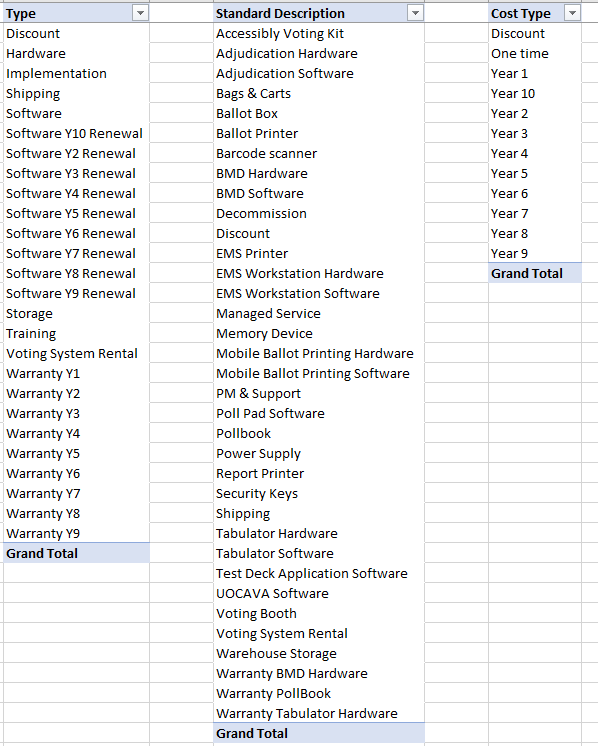
Type, Standard Description and Cost Types are below.
So putting this all together for a single county, the raw data in my analysis looks like this.
Total Contract Cost Analysis
Let’s first look at the value of all of the contracts by Standard Description total. This is for 26 Counties and 3 States.
Tabulator Hardware, Warranty and Software comprise ~ 75% of the total cost. Add in the professional services and you reach a total of 85%. With BMD Hardware you reach ~ 88%. Finally add in Pollbooks and the total is 93%. So in summary, based on the Standard Description of the contract cost items, 93% of the cost is linked to.
Tabulator hardware/warranty/software
Professional services
BMD hardware
Pollbook hardware/warranty
Next, let’s break down the total costs by jurisdiction.
Here are the first 15 counties.
Here are the remaining counties and 3 states.
In summary, the county contracts range from ~ 136k to 12.6MM. The states range from 7MM to 139MM.
Election Cost Over Time
First, election equipment is only used at discrete times during it’s life cycle. For example, one could assume an 11 year equipment life cycle because all technology eventually becomes obsolete. With that assumption of 11 years, 6 election cycles would occur, not counting special elections or primaries. The investment made in election machine technology would need to be made all over again, after 11 years, one could reasonably ASSUME. Again, this is an assumption, but in order to normalize data over a wide range of jurisdictions, assumptions will need to be made.
Second, in order to work with this 11 year election technology end of life cycle, the total number of ballots (not votes, ballots) counted for all 6 elections will need to be calculated. This is not too difficult. The baseline registrations in each jurisdiction is known today. One can also make reasonable assumption about turnout per election cycle and growth in registrations. Remember, the idea here is to build a model and use a magnifying glass (not a microscope) to frame the analysis. To that end, I have assumed a 70% turnout for presidential cycles and 60% turnout for non-presidential cycles. I also am going to ignore special elections and primaries because the net effect on the total number of ballots counted over 11 years on a % basis is small.
Putting all of that together results in a table like the one below. The purpose is to calculate the cost per ballot over 11 years.
The assumptions: 2% growth in baseline registrations, 70% presidential year turnout, 60% non-presidential turnout, Y1 Turnout is Presidential.
You can quibble with my assumptions but the point is, there is a wide range in costs per ballot. Why is that?
You’ll need to read part 2 for an answer as we dig into the details further.


