Introduction
Question: Is CTCL misrepresenting the information on the IRS Form 990 stating that the PURPOSE of the grants were to help support the SAFE administration of public elections during the Covid-19 pandemic?
Answer: It appears so given the results of both aggregate, state and county by county analysis as we will see below. It appears this is a quantifiable democrat ballot harvesting operation.
Background
This is Part XI in The NGO Project series which examines the role NGOs had in determinative outcomes in the 2020 Presidential Election. In prior articles, I focused on the effect CTCL had on AZ, CO, CT, GA, MI, NM, NY, PA, UT, VA and WI.
This article will solely focus on CTCL in Texas (TX).
Calculation Basis
The calculation basis was previously explained in detail here. In this article, I do make one adjustment and that is to calculate the 2020DIFF factor by weighted average rather than arithmetic average.
Analysis
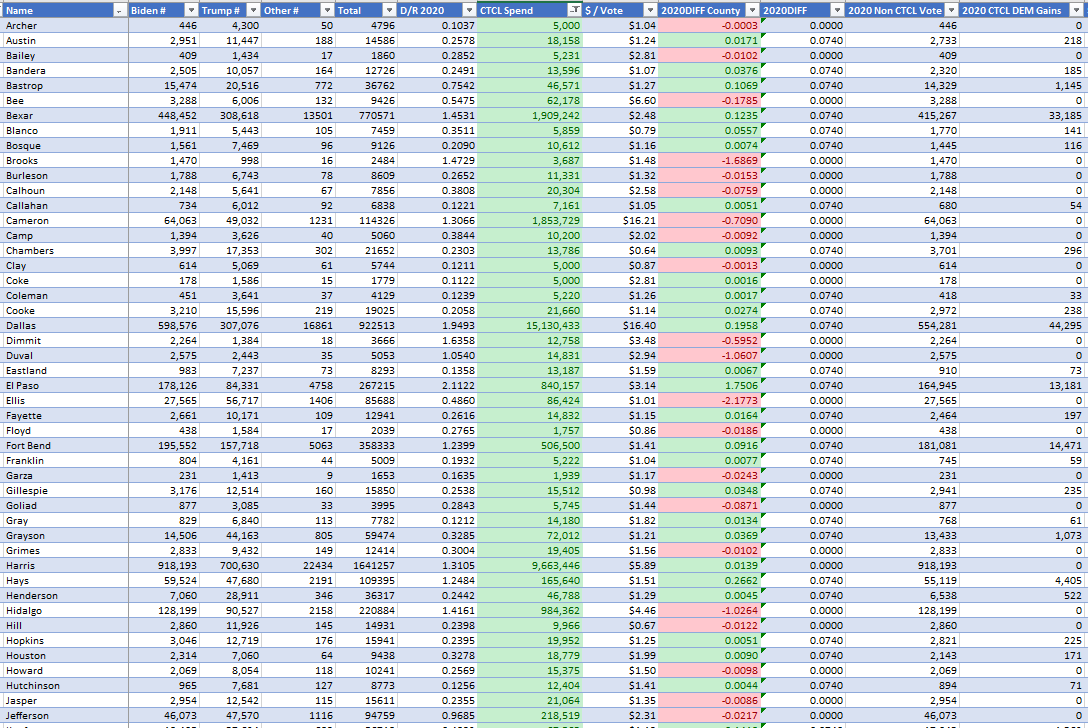
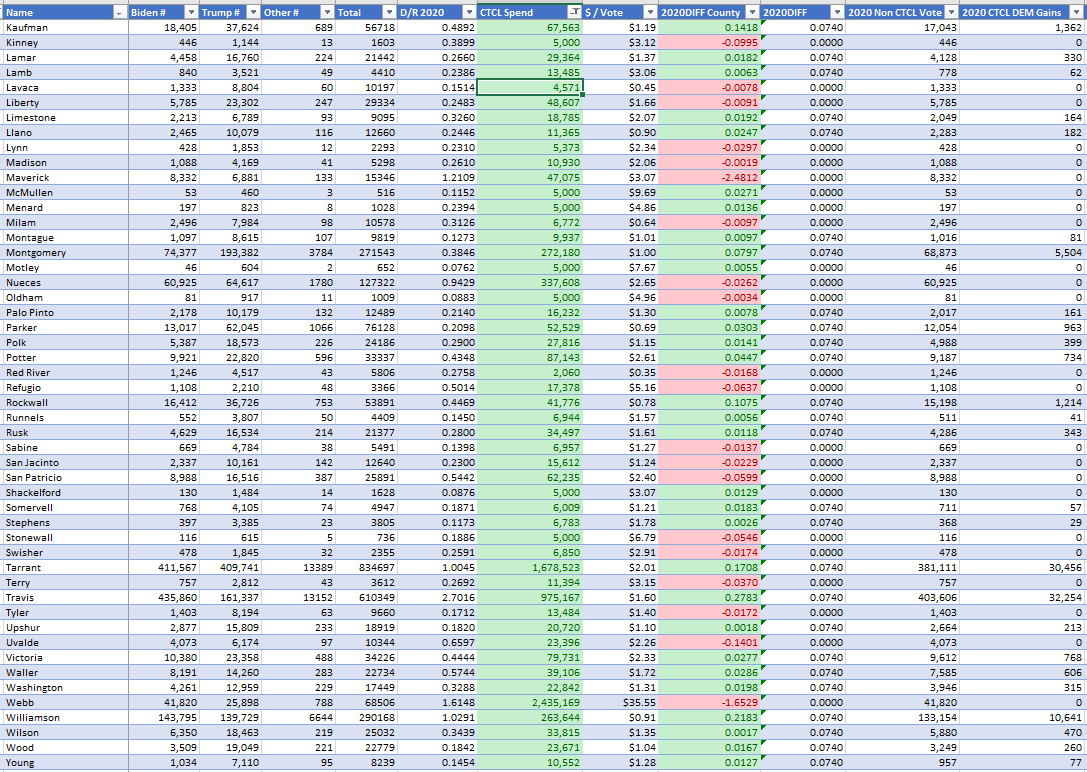
97 of 254 Texas counties (38%) received CTCL grants.
Total votes cast in CTCL counties were ~ 7,874,388 (78%) and NonCTCL counties were ~ 3,450,948 (22%). To state it a different way, on a per county basis, CTCL had the opportunity to influence 78% of TX voters.
The total amount of grants to TX was ~ $38,905,364 and the value of individual grants ranged from ~ $1,700 to $15,000,000.
This table includes the top 10 CTCL grants by county.
$35,976,728 of the grants (92%) were focused in the 10 counties above. The $/vote spent by CTCL in these five counties range from $1.41/vote to $35.55/vote (all parties). The vote totals in these 10 counties account for ~70% of the votes in TX.
To state that a different way, 92% of the grants were spent on70% of the total votes cast in TX. Is that fair if this was all about a Plandemic?
The average 2016 D/R ratio for CTCL Counties was 0.569 (not weighted). The average 2016 D/R ratio for NonCTCL Counties was 0.439 (not weighted). This means that CTCL grants were provided to more D leaning counties. The top 5 counties in terms grants had a average 2016 D/R ratio of 1.93….big time D areas for sure. This is 5x the NonCTCL county average in 2016. More bias in favor of D.
To continue on this track, if you look at all the counties in 2016 that had a D/R ratio of less than one (R leaning counties), there were 227 (89%) counties. In total, they received ~ $5,282,000 in grants in 2020. This is a stingy ~ 13% of the total 2020 CTCL grants in TX. These counties contributed 4.9MM votes (all parties) in 2016 which is 48% of the vote total.
To put it a different way, 13% of the 2020 CTCL grants went to counties where 48% of the votes were cast in 2016 in NonCTCL counties. More bias in favor of D.
The top 10 R leaning counties in 2016 that received CTCL money in 2020…..
Do these facts alone confirm or disapprove my thesis that the grants were NOT used for public safety?
2020DIFF Calculated with Weighted Average
For this analysis, I used a slightly different way to calculate the 2020DIFF using a weighted average based on total votes in a county. This is what it looks like.
w = Total County Vote / Total State Vote
a = D/R2020 - D/R2016 (for CTCL Counties)
a' = a * w (per county)
2020DIFF = sum(a'1:a'n)
This method in theory permits a better correlation for D vote harvesting because it is weighted for counties with higher vote totals.
The 2020DIFF for CTCL counties is 0.074 and for NonCTCL counties it is 0.056. This means that the CTCL D vote harvesting factor in CTCL entities is 0.074-0.056 = 0.026 or ~ 3%.
But wait, in TX it get’s more interesting.
Excluding Collin and Denton counties, all other NonCTCL counties (155 of those) have a 2020DIFF of effectively 0.0. What might this mean?
Collin and Dillon are adjacent to Dallas who received ~ 15MM in Zuckerbucks. My conclusion has to be that Collin and Denton were impacted by there proximity to Dallas.
If we exclude those two counties, the 2020DIFF factor becomes a whopping 7.4% D vote harvesting factor from CTCL meddling (0.074-0.000).
For the sake of this analysis, I will apply the 7.4% factor to CTCL counties to see worst case, what the D vote harvesting could have been in theory. This results in ~202,000 additional D votes or a potential swing of ~404,000 votes total.
Trump beat Biden by ~ 600,000 votes so by these calculations, that could have been as high as 1MM votes.
These are all of the CTCL counties.
Noteworthy R Stalwarts
I am adding a new section for this article highlighting the top 5 R stalwarts in terms of -2020DIFF which indicates higher R turnout as a ratio to D between 2016 and 2020. Maverick County received Zuck Bucks but still rocked a -3.07 2020DIFF. May I ask what Ellis did with the “odd” value of $86,424 dollars? Why not ask for a nice round number like $86,000 or $86,500? I am sure the Zucks could have afforded it.
Conclusion
CTCL issued ~$38.9MM grants in TX and “purchased” ~ 202,000 more D votes in CTCL counties than would have occurred without CTCL grants.
That is ~ $192/Vote.
Pretty good return on your investment if you are part of the election racketeering cabal.
References
CTCL IRS Form 990 (revised form from Jan 2022 used)
Telegram - https://t.me/electiondataanalyzer
Truth - @ElectionDataAnalyzer
The math here is simple, try this on your own. It is a model to look for trends, not an exact science.


