
The NGO Project Part XXI: Swing States
The NGO Project Part XXI: Swing States
CTCL Activity in the Swing States

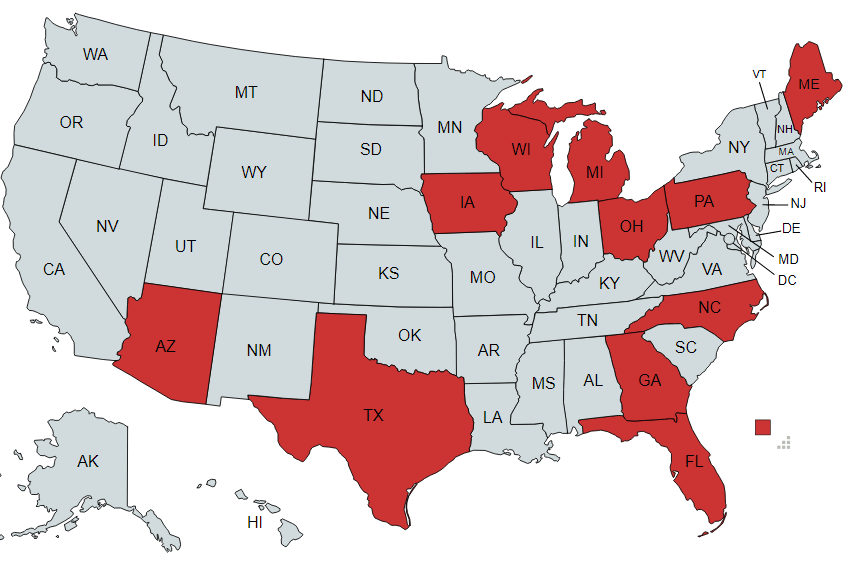
This is an overall summary of all the swing states.
About 1,000 grants in total were made by CTCL to swing states totaling ~ $200,000,000. These were spread out amongst 453 of the 1020 counties in these swing states. This means that CTCL grants were made to 44% of the counties. These grants were provided to cities, townships, counties and in some cases, to the states directly.
[Edited] The average 2016 D/R ratio for CTCL counties is 0.75. The 2016 D/R ratio for NonCTCL counties is 0.548. This basically indicates that in 2020 CTCL funds were distributed to on average, more D leaning counties by ~ 20%. [Edited]
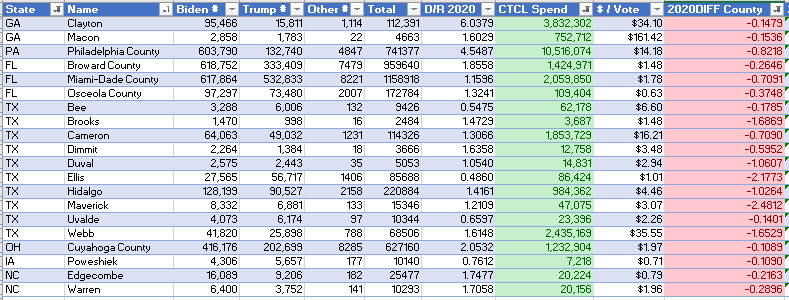
Of the 453 counties, 166 them (37%) showed a -2020DIFF value, meaning that despite CTCL grants, the voters shifted more R in the D/R ratio in 2020. To say it a different way, 63% of the counties where CTCL money was provided trended more D in the D/R ratio in 2020. Here are the top 20 counties based on -2020DIFF (most R trending).
The 2020DIFF weighted average values for each swing state are listed below:
Arizona - 12% ~ 173,000 D votes
Florida - 0%
Georgia - 18% ~ 250,000 D votes
Iowa - 15% ~ 75,000 D votes
Maine - 2% ~ 59,000 D votes
Michigan - 6% ~ 940,000 D votes
North Carolina - 16% ~ 166,000 D votes
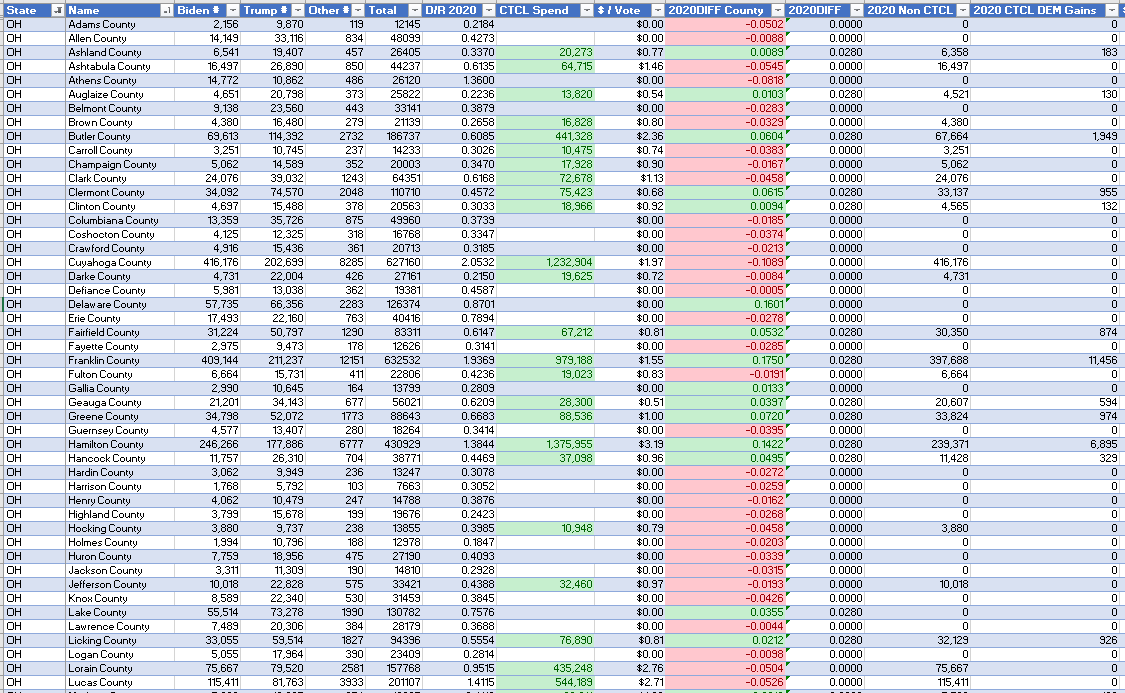
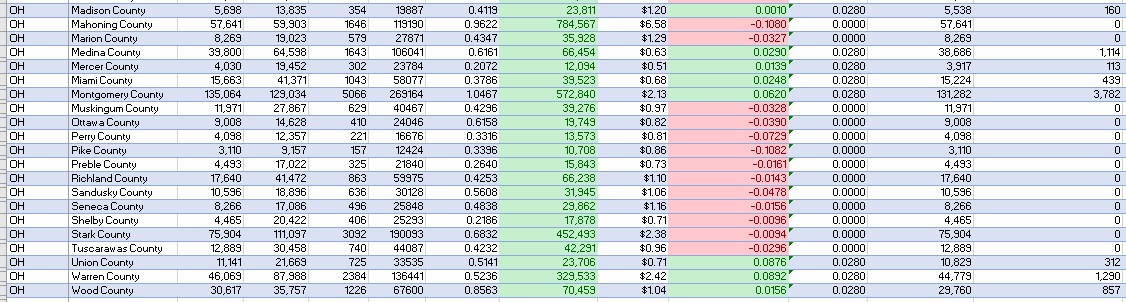
Ohio - 3% ~ 34,000 D votes
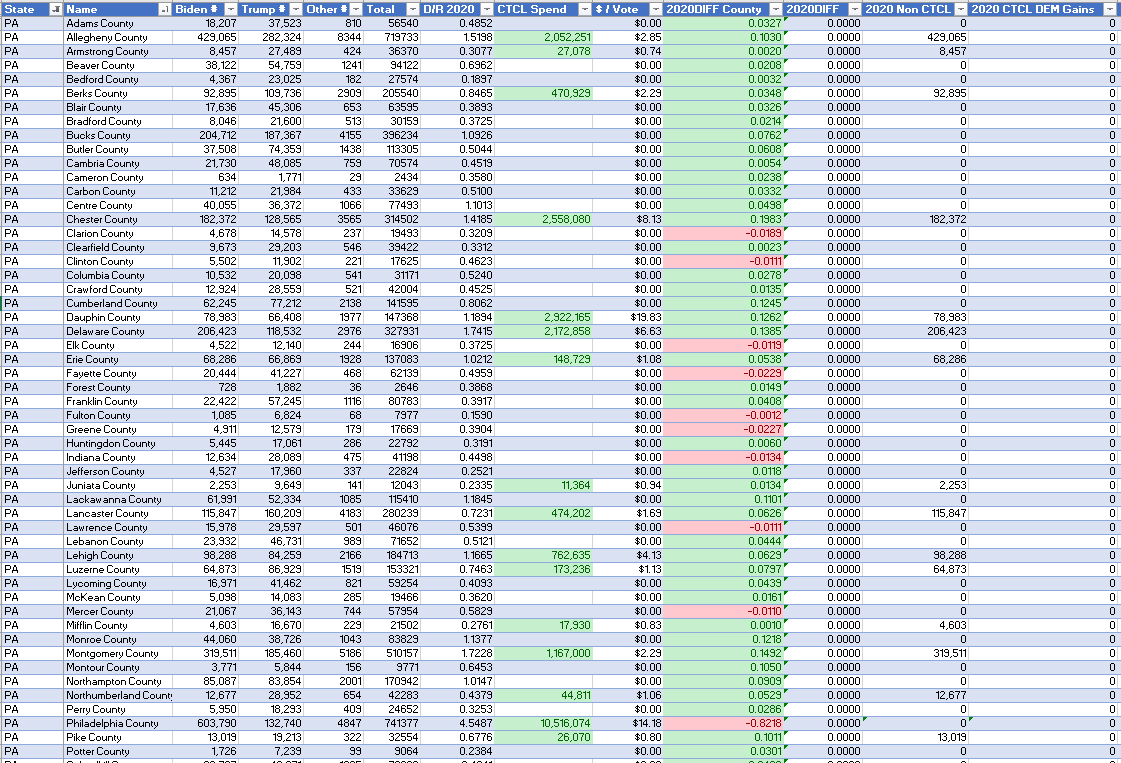
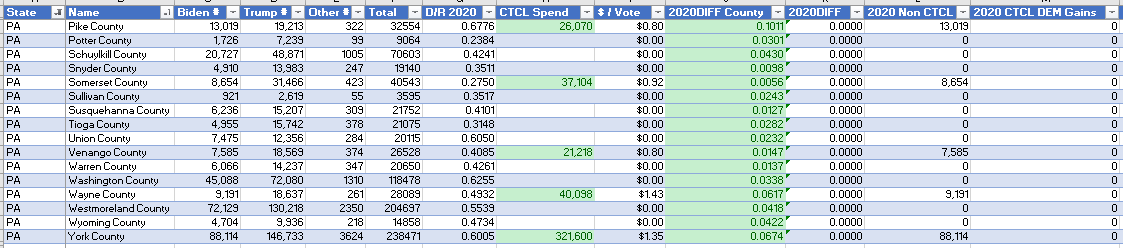
Pennsylvania - 0%
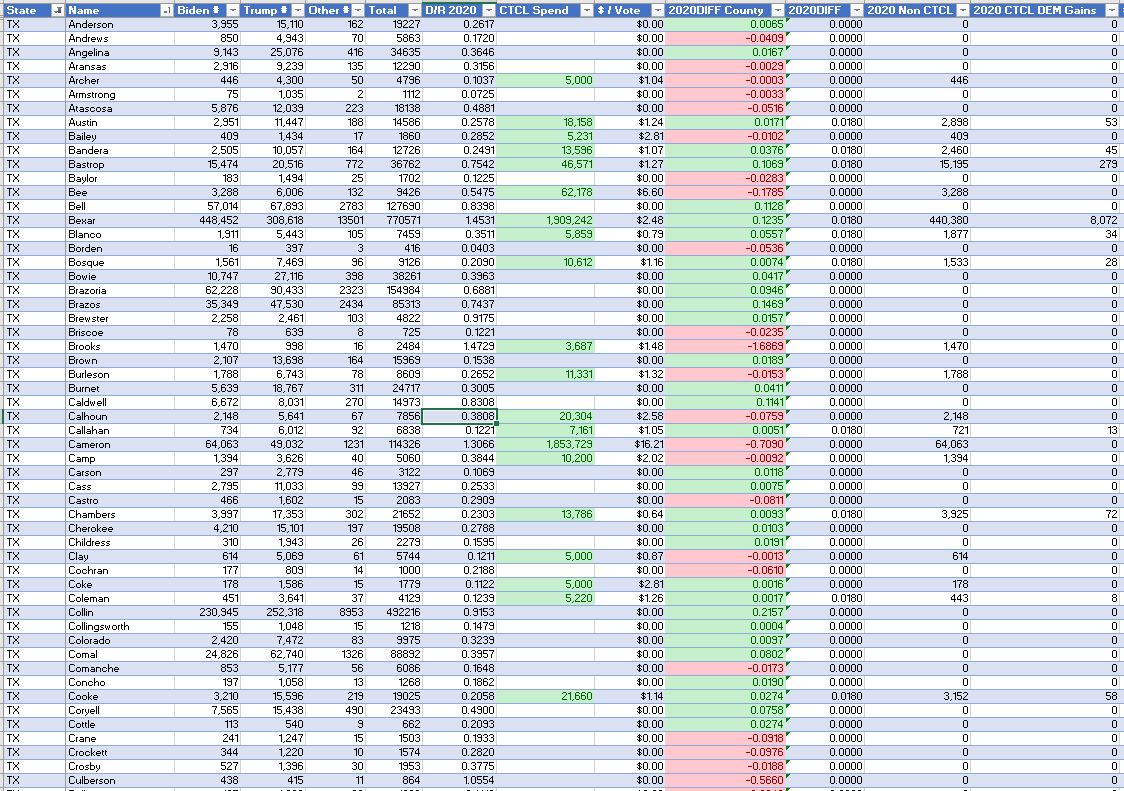
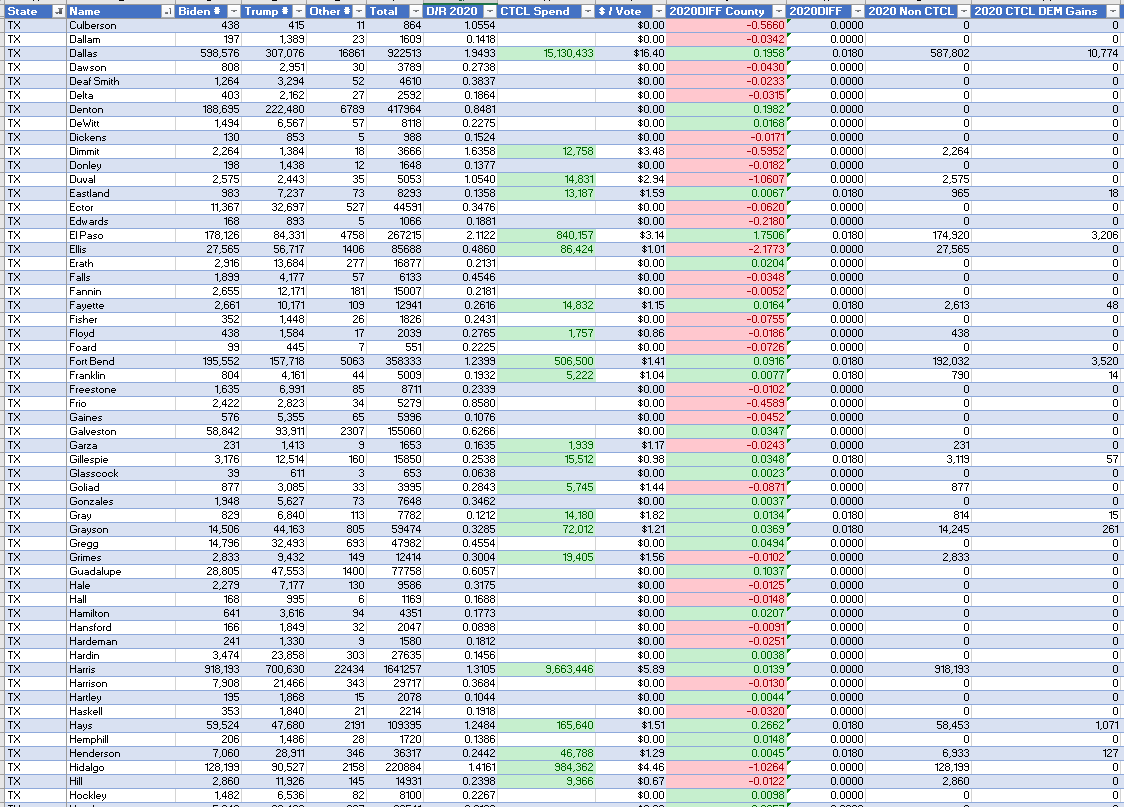
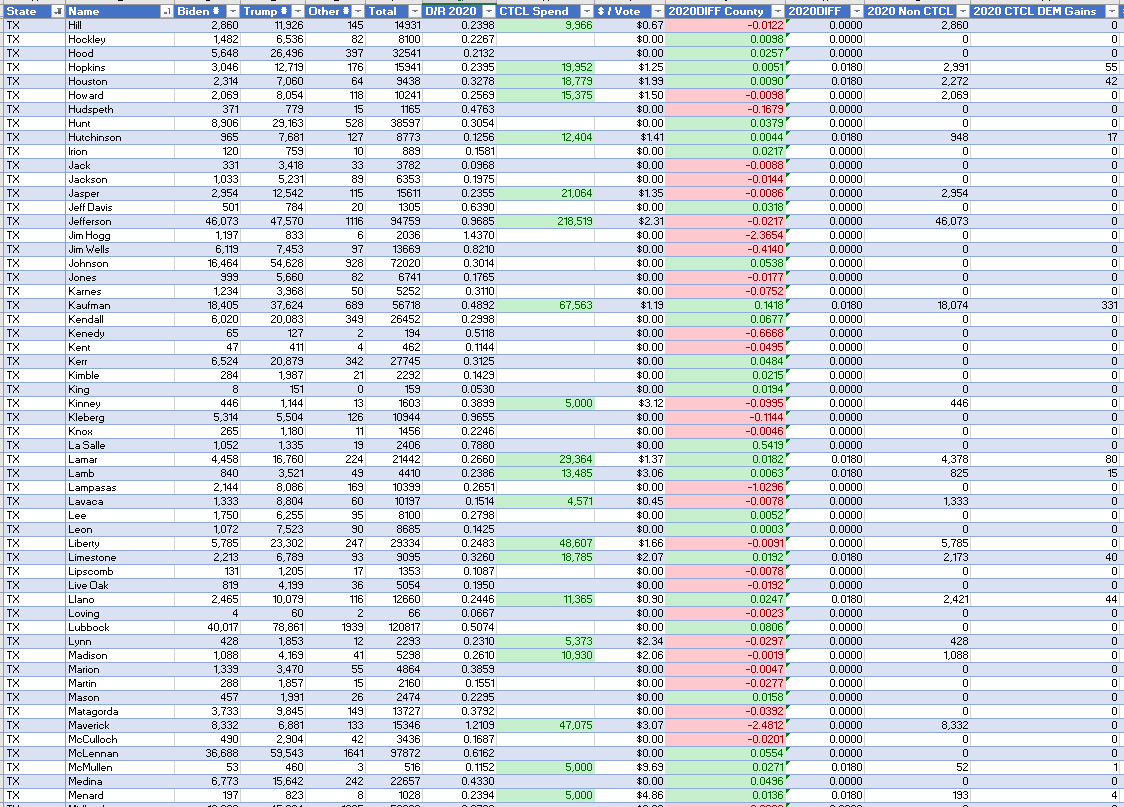
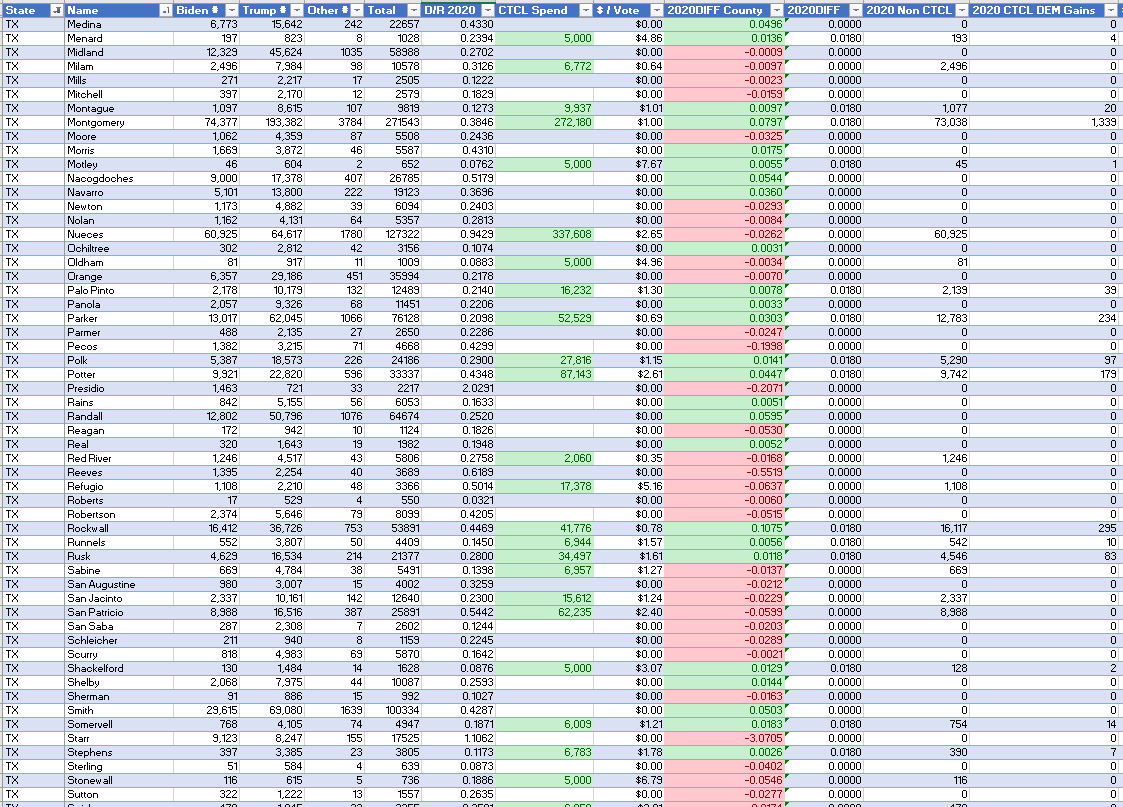
Texas - 2% ~ 50,000 D votes
Wisconsin - 3% ~ 43,000 D votes
Total D Harvesting ~ 1.8MM
[In the individual articles I had previously posted on these states, in some cases I was using an arithmetic average but standardized for this article around weighted average. I have revised the 2020DIFF calculations for some states above.]
So what happened in FL and PA? Why 0%?
In PA it really comes down to what happened in Philadelphia County. Despite CTCL spending of $10.5MM, the county still had a -2020DIFF of a whopping -0.822 (meaning it trended heavier R in the ratio). Because we are using a weighted average, this essentially caused the state 20202DIFF to be 0 and not allow D vote contributions (super “conservative” assumption on my part in this model by the way).
Based on the data I have looked at, for Philadelphia County to trend this much to the R’s in 2020, there must have been massive cheating to result in a D win.
FL is an outlier. The title of my FL article is “FL Strong”. I would point to that for an explanation.
The top 20 counties in terms of $/vote are listed below. It ranges from ~ $10-$161 per vote (all parties).
What is world happened in Macon County GA? $161/vote cast? Some Plandemic response there huh? If you are from Macon, I would recommend looking at the county budget for fiscal year 2020. In fact, if you are from any of the above counties, that would be an interesting dig.
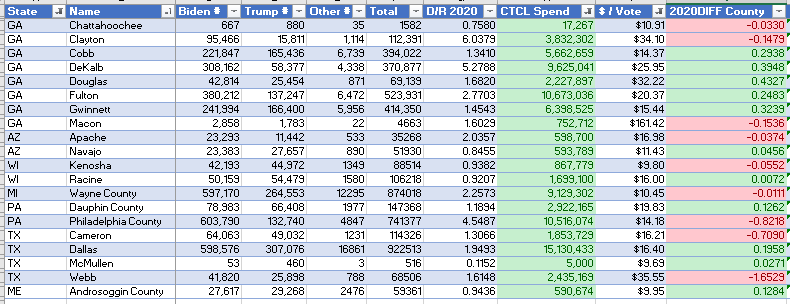
The top 20 counties in terms of +2020DIFF overall are listed below. The 2020DIFF ranged from 0.1959 to 1.751. These are the counties which shifted most to D. The average 2020DIFF for these counties is 0.370 (37%). CTCL spent 45MM in these counties or ~ 15% of all CTCL dollars.
What happened in El Paso County TX with a 2020DIFF of 1.751? If you live there, beware….
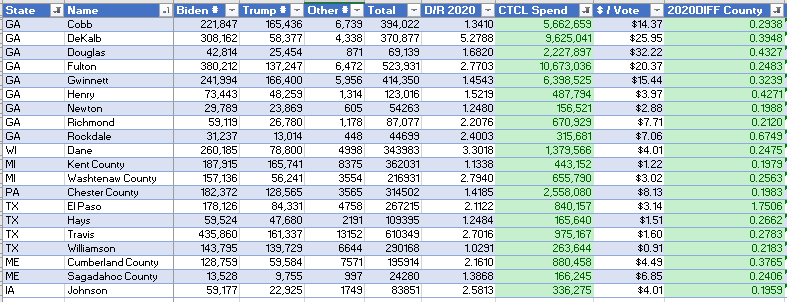
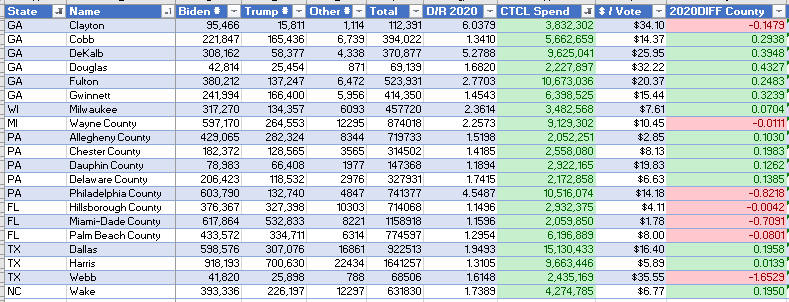
The top 20 counties in terms of CTCL spend are listed below which totals to 114MM or ~ 30% of all of the CTCL spend, in 20 counties! Again, if you live here, pull the county budgets for fiscal year 2020 and dig.
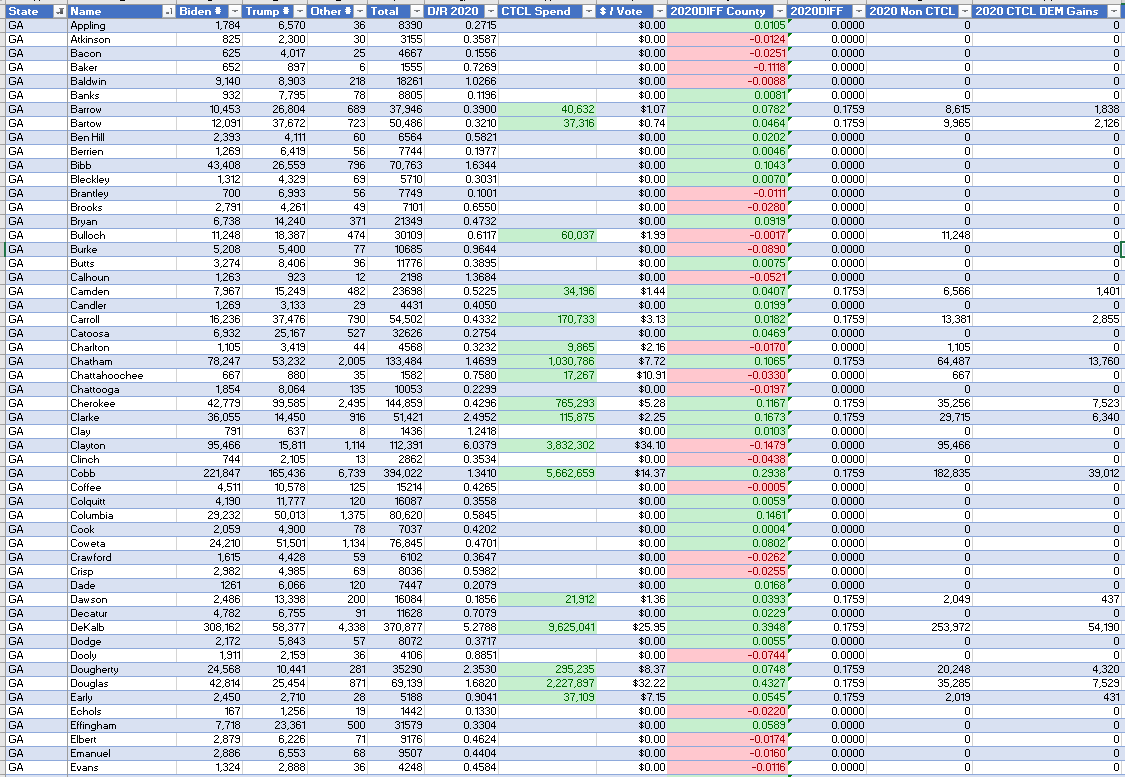
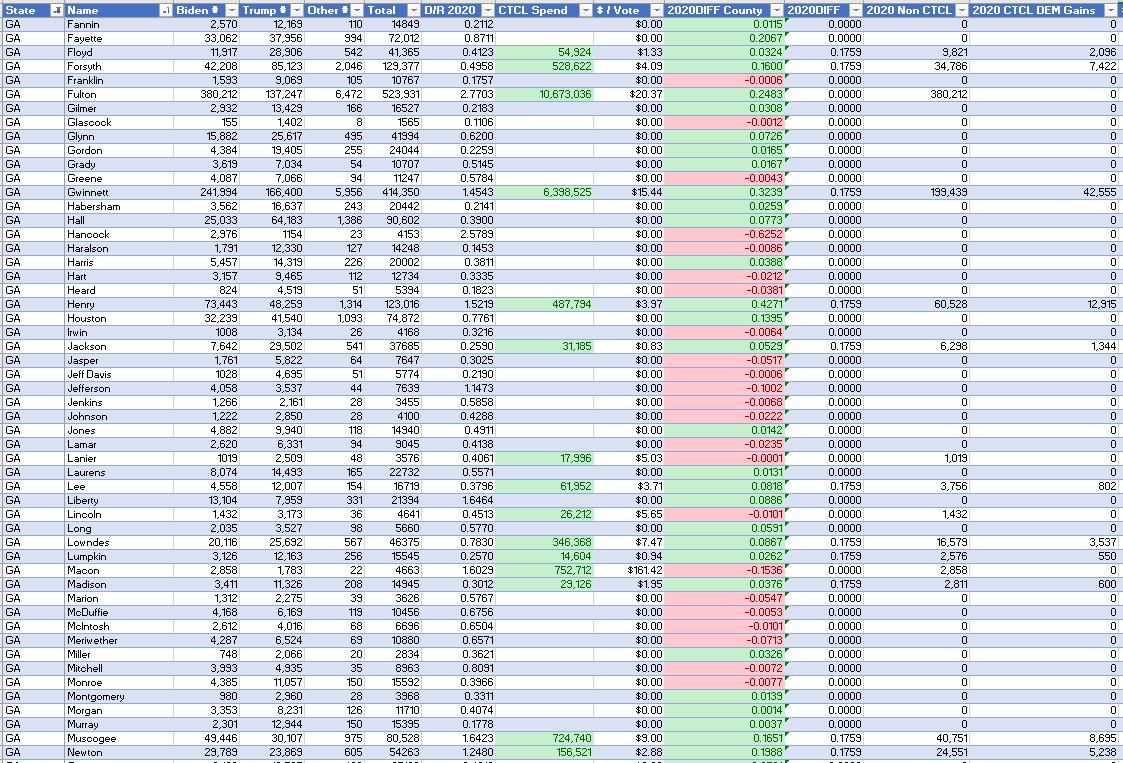
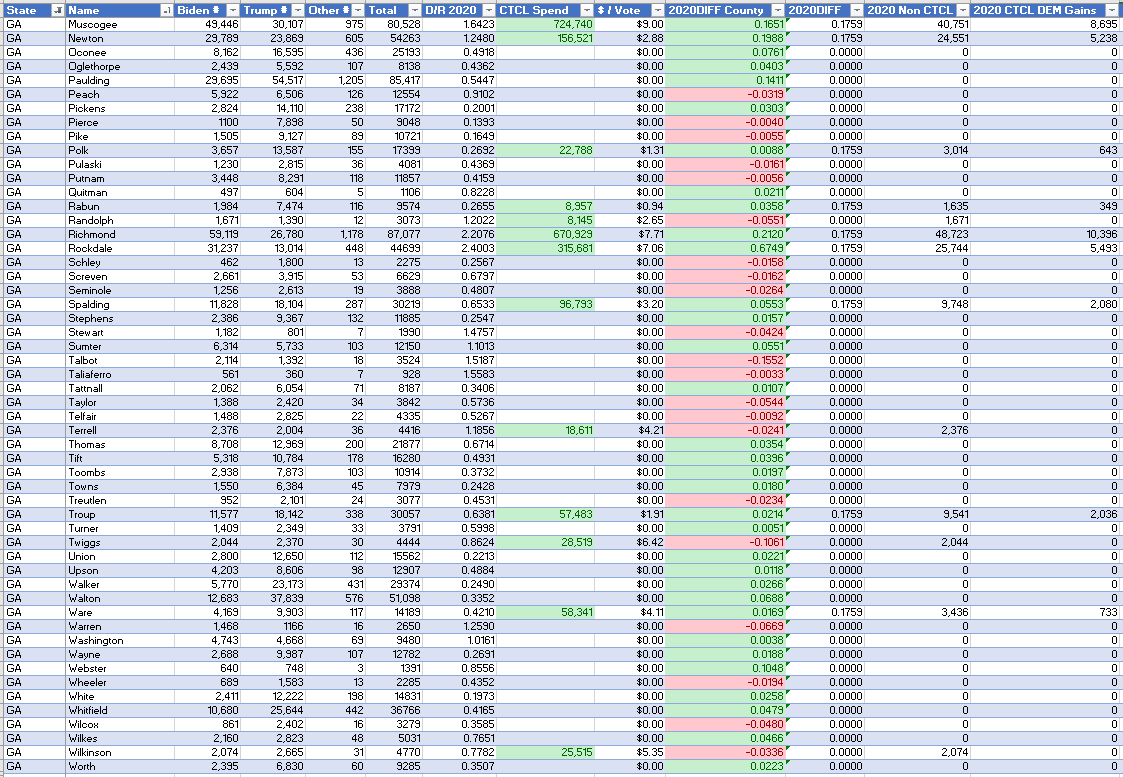
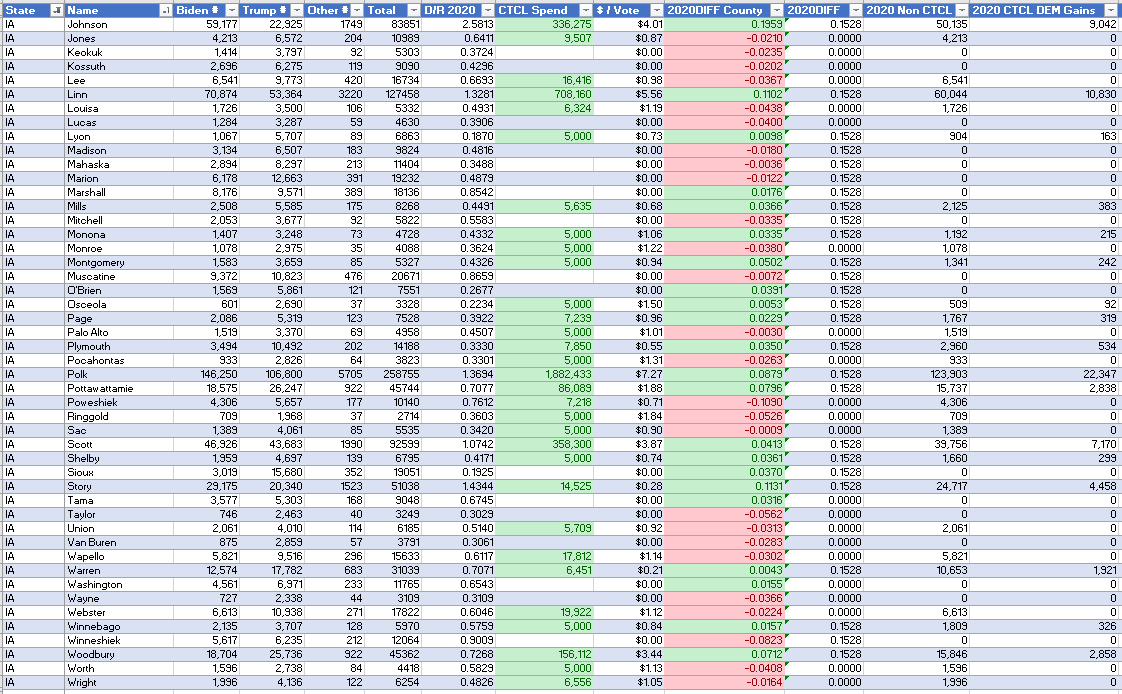
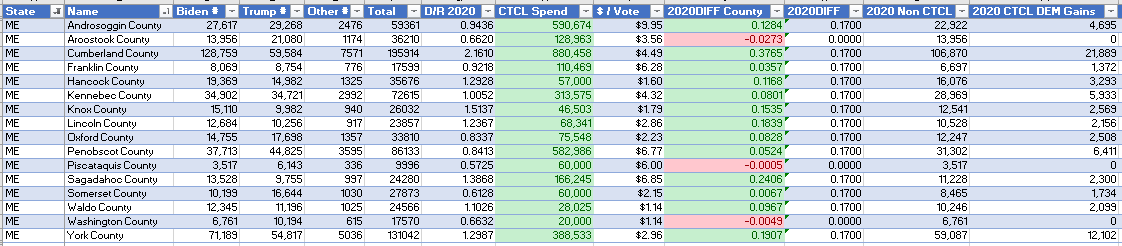
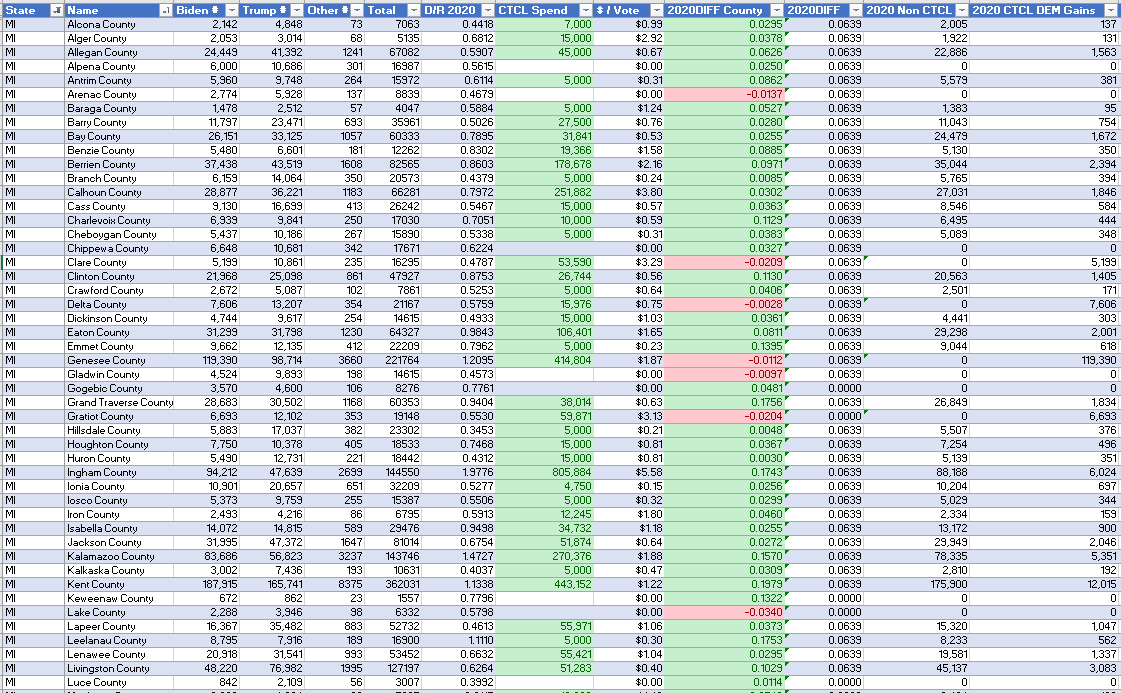
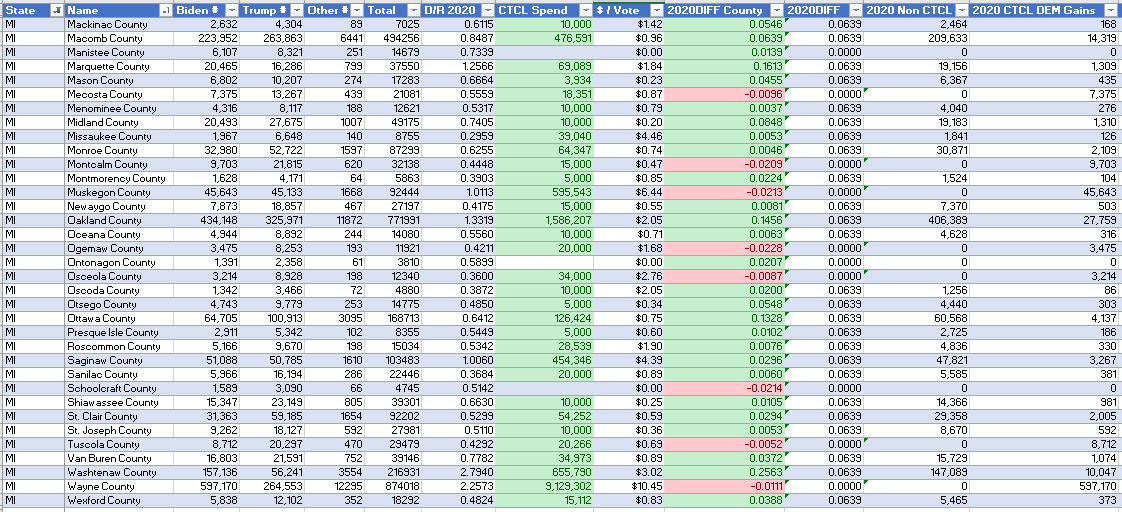
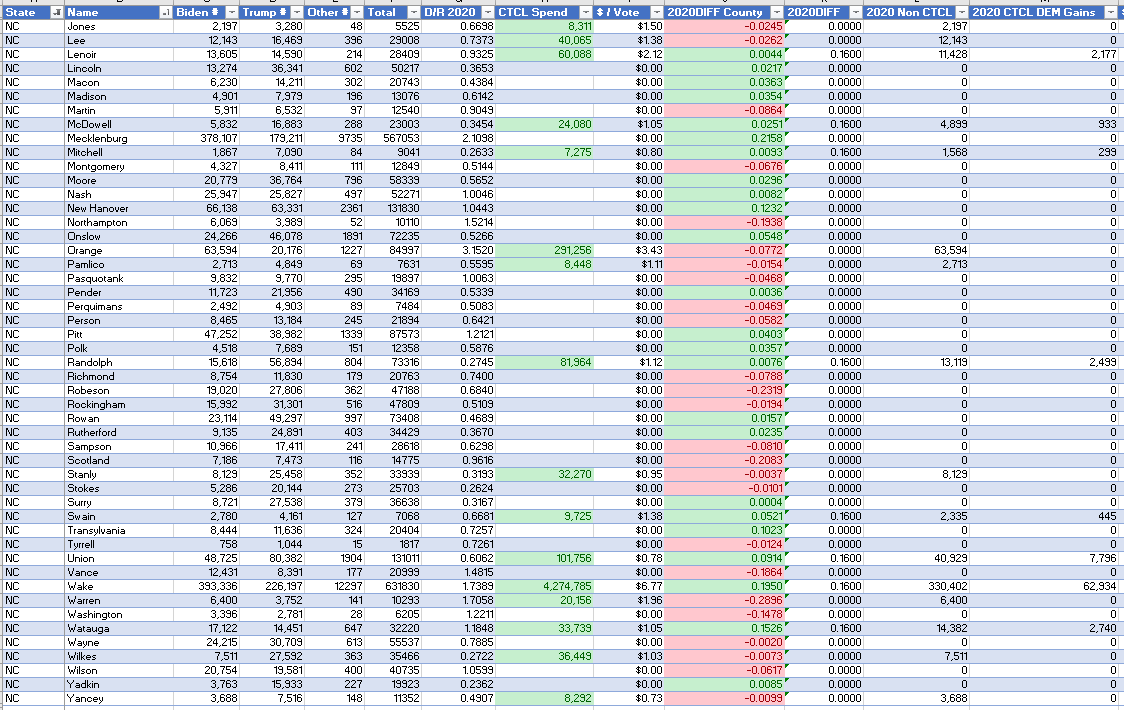
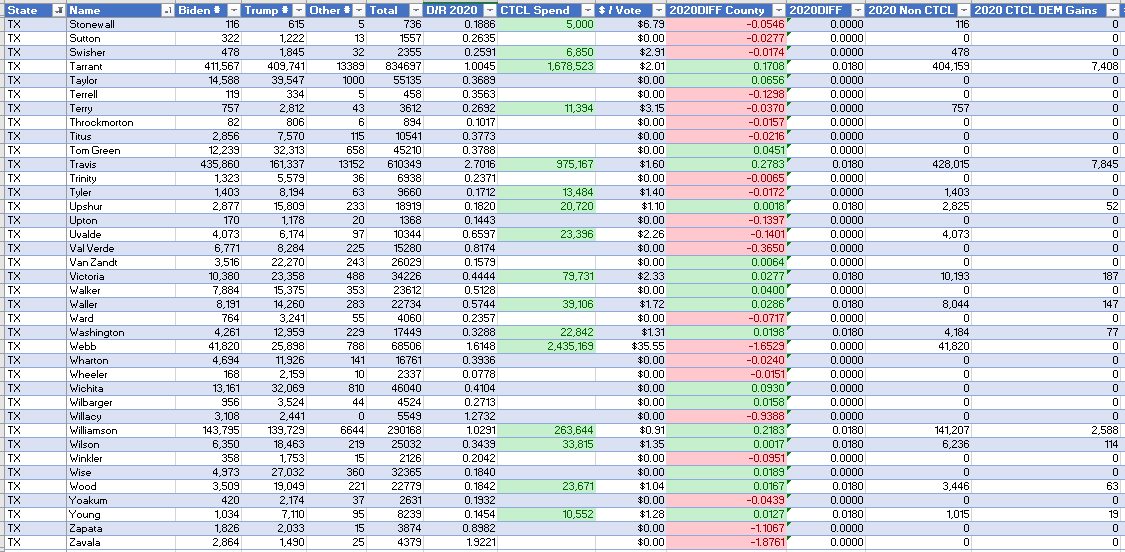
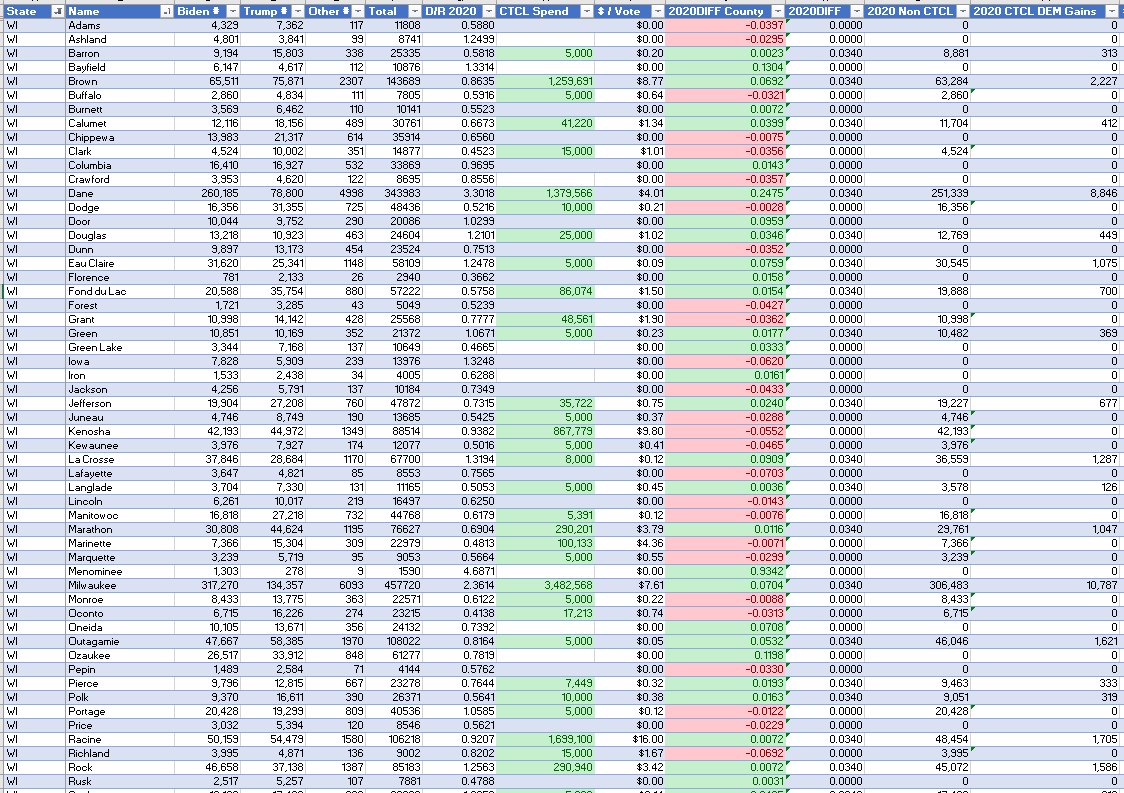
All Swing States results are summarized below for reference.
Arizona
Florida
Georgia
Iowa

Maine
Michigan
North Carolina

Ohio
Pennsylvania
Texas
Wisconsin

CTCL IRS Form 990 (revised form from Jan 2022 used)
Telegram - https://t.me/electiondataanalyzer
Truth - @ElectionDataAnalyzer
The math here is simple, try this on your own. It is a model to look for trends, not an exact science.