Introduction
Question: Is CTCL misrepresenting the information on the IRS Form 990 stating that the PURPOSE of the grants were to help support the SAFE administration of public elections during the Covid-19 pandemic?
Answer: It appears so given the results of both aggregate, state and county by county analysis as we will see below. It appears this is a quantifiable democrat ballot harvesting operation.
Background
This is Part XXXII in The NGO Project series which examines the role NGOs had in determinative outcomes in the 2020 Presidential Election. In prior articles, I focused on the effect the Center for Technology and Civic Life (CTCL) had on AZ, CO, CT, GA, IA, IL, ME, ME, MI, MN, MT,NC, NH, NJ, NE, NM, NY, OH, OR, PA, RI, TN, TX, UT, VT, VA, WA and WI.
This article will solely focus on CTCL in Utah (UT) which is a restatement of my earlier analysis using a weighted average this time.
Calculation Basis
The calculation basis was previously explained in detail here. In this article, I do make one adjustment and that is to calculate the 2020DIFF factor by weighted average rather than arithmetic average.
Analysis
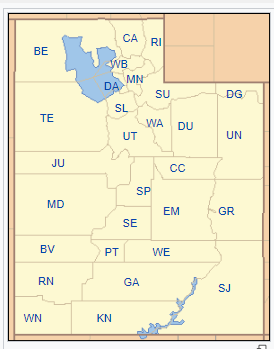
2 of 29 UT counties (7%) received CTCL grants.
Total votes cast in CTCL counties were ~ 342,051 (23%) and NonCTCL counties was ~ 1,146,238 (77%). To state it a different way, on a per county basis, CTCL had the opportunity to influence 23% of UT voters.
The total amount of grants to UT was ~ $295,601 and the value of individual grants ranged from ~ $53,946 to $241,655.
This table includes the CTCL grants by county.
The $/vote spent by CTCL in these counties range from $0.85/vote to $0.94/vote (all parties). The vote totals in these 2 counties account for ~59% of the votes in UT.
To state that a different way, 100% of the grants were spent on 59% of the total votes cast in UT. Is that fair if this was all about a Plandemic?
The average 2016 D/R ratio for CTCL Counties was 0.342 (not weighted). The average 2016 D/R ratio for NonCTCL Counties was 0.362 (not weighted)….about the same.
What is different about UT is that the top 2016 D/R counties did not receive grants. Those would be Summit (1.432) and Salt Lake (1.274). These are the only 2 counties in 2016 that had a D/R greater than 1.
I will leave it to the locals to figure that one out.
The only conclusion I can come to is that the close geographic proximity of the CTCL counties (CA and UT below) had a +2020DIFF impact on the NonCTCL counties (SL and SU below). All the “fun” is clustered around the Great Salt Lake….hmmm. This looks like a regional play to me.
2020DIFF Calculated with Weighted Average
For this analysis, I used a slightly different way to calculate the 2020DIFF using a weighted average based on total votes in a county. This is what it looks like.
w = Total County Vote / Total State Vote
a = D/R2020 - D/R2016 (for CTCL Counties)
a' = a * w (per county)
2020DIFF = sum(a'1:a'n)
This method in theory permits a better correlation for D vote harvesting because it is weighted for counties with higher vote totals.
The 2020DIFF for CTCL counties is 0.107 and for NonCTCL counties it is 0.023. This means that the CTCL D vote harvesting factor in CTCL entities is 0.107-0.023 = 0.084 or ~ 8%. The number of D votes harvested based on this model is “conservatively” ~7,800 D votes or a potential swing of ~ 15,000 votes.
These are all of the CTCL counties.
Noteworthy R Stalwarts
These are all of the R stalwarts in terms of -2020DIFF which indicates higher R turnout as a ratio to D between 2016 and 2020. Not a single one took CTCL money.
Conclusion
CTCL issued ~$295,00 grants in UT and “purchased” ~ 7,800 more D votes in CTCL counties than would have occurred without CTCL grants. Not enough to turn the state Blue.
That is ~ $38/Vote.
Not a good return on your investment if you are part of the election racketeering cabal.
All Counties
References
CTCL IRS Form 990 (revised form from Jan 2022 used)
Telegram - https://t.me/electiondataanalyzer
Truth - @ElectionDataAnalyzer
The math here is simple, try this on your own. It is a model to look for trends, not an exact science.


