Voter Registration Patterns - Camden, NJ
Do humans behave this way?

Looking at the data, one has to ask, “Do humans behave this way?”
Is this random human behavior or does this look like a process that is controlled?
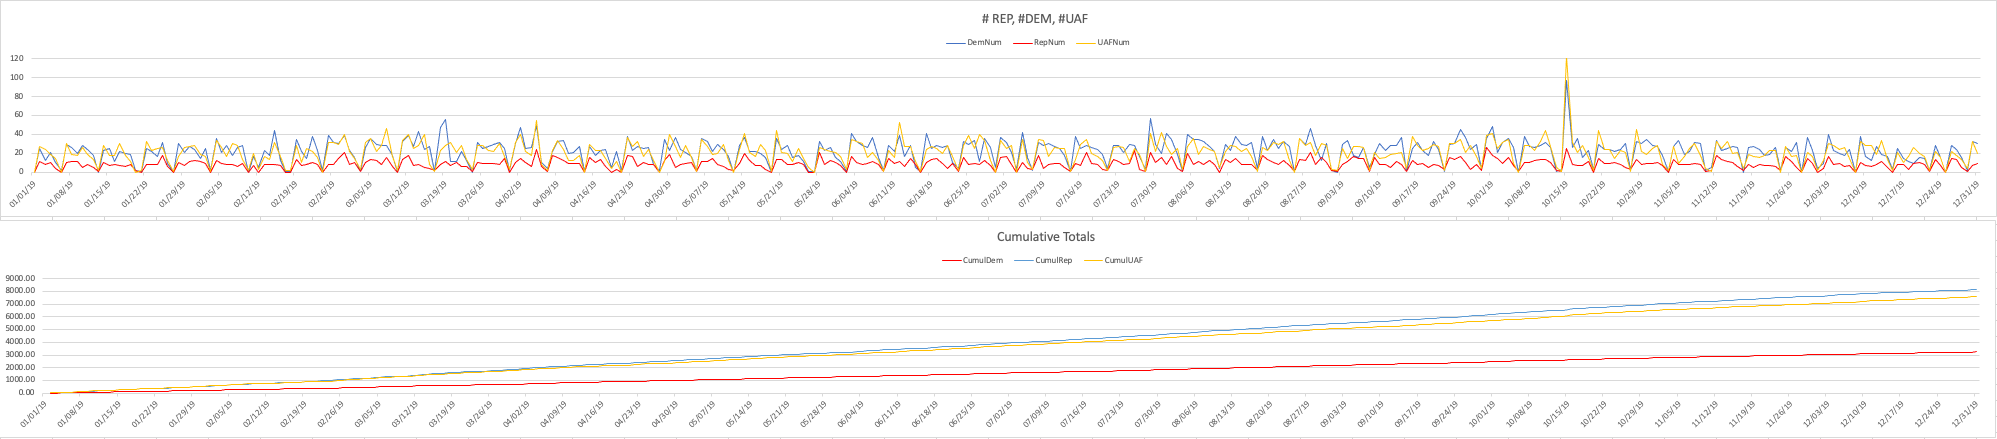
This is data from 2019 Camden NJ aggregated by week.
In this county for all but 5 weeks the number of registrations never exceeded 40 for any party. The week of 10/15/19, there is huge spike in UAF and DEM that REP don’t share. Interesting.
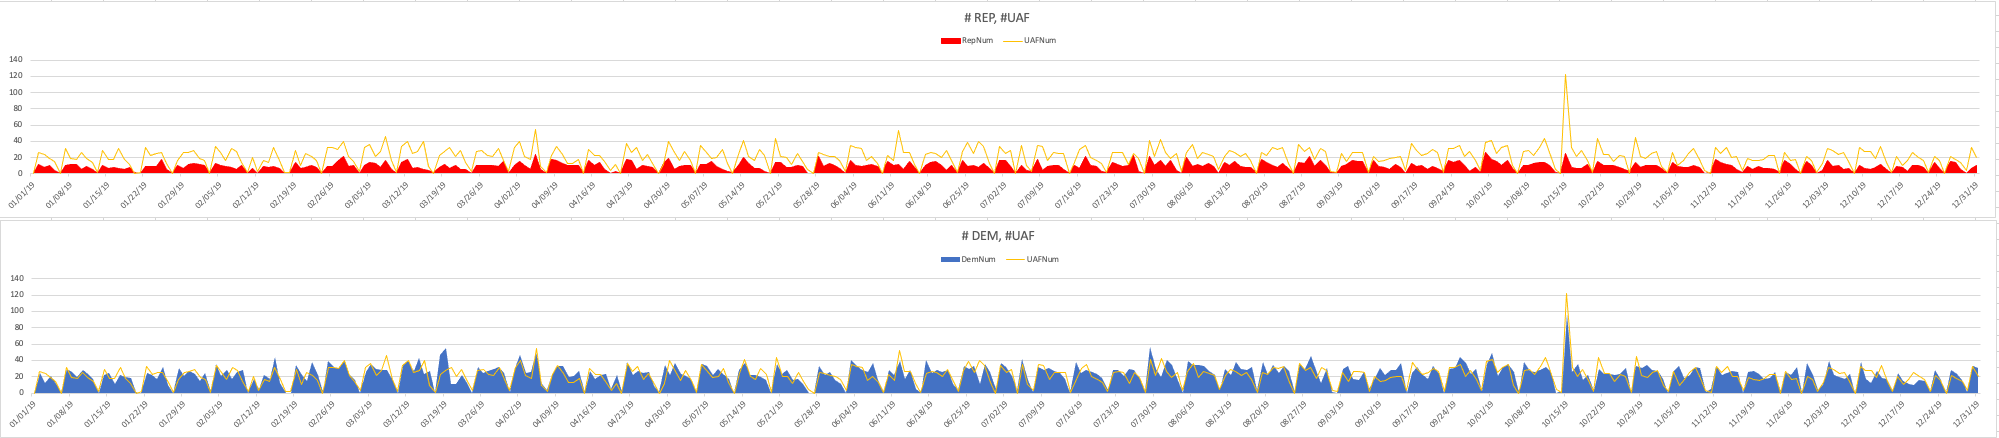
This is the same data comparing DEM vs UAF and REP vs UAF. So in this visually, DEM and UAF appear to move in lock step.
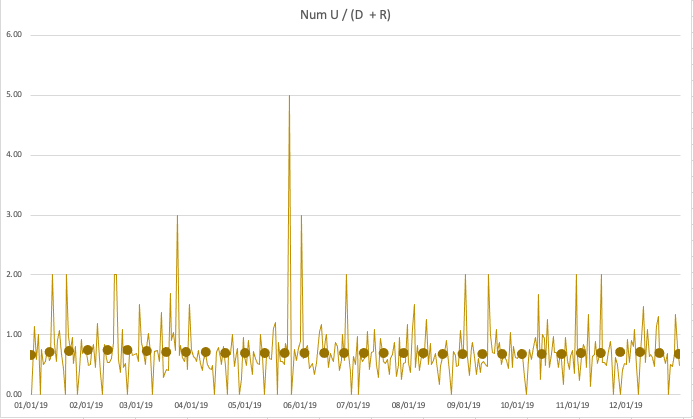
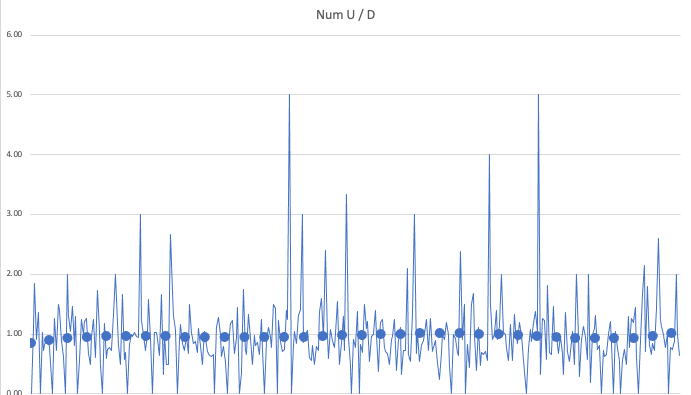
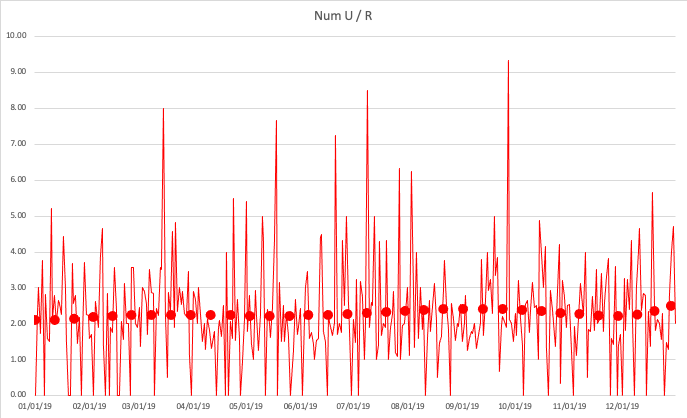
The ratio of U, D, and R counts to one another curve fit to a 6th order polynomial.
Human behavior or controlled opposition? You decide.
Sixth order polynomial. Ouch. I watched a YouTube video...still ouch! Thank God a picture is worth a 1,000 words.
Thank you for this. I appreciate how hard you work on these complexities. Legions couldn't do it. I know it is solid proof.
But if this was a game of horseshoes and U, D, and R were thrown at the stake (distance from it having a points gained structure), the stake being Camden's number of registrations would the pool of precincts (each horseshoe) be "scored" formulaically also?
For my less than mathematical brain, I always go to the precinct level to find patterns. The primary election result numbers I have looked at are pure fantasy.
Aside from all of the above, how many precincts does Camden have? Thanks again. Your work has helped me very much.