
El Paso County CO Voter Roll Churn
El Paso County CO Voter Roll Churn
Part 5 in the "Nothin To See Here" Series

Introduction
I would recommend reading this and this to understand the methodology of using a HASH analysis to look at voter roll “churn”. The quick summary is that I created a HASH for every voter ID:
[@[VOTER_ID]]&"_"&TABLE1[@[LAST_NAME]]&"_"&TABLE1[@[FIRST_NAME]]&"_"&TABLE1[@[MIDDLE_NAME]]&"_"&TABLE1[@[NAME_SUFFIX]]&"_"&TABLE1[@[STATUS_CODE]]&"_"&TABLE1[@[HOUSE_NUM]]&"_"&TABLE1[@[HOUSE_SUFFIX]]&"_"&TABLE1[@[PRE_DIR]]&"_"&TABLE1[@[STREET_NAME]]&"_"&TABLE1[@[STREET_TYPE]]&"_"&TABLE1[@[POST_DIR]]&"_"&TABLE1[@[UNIT_TYPE]]&"_"&TABLE1[@[UNIT_NUM]]&"_"&TABLE1[@[RESIDENTIAL_CITY]]&"_"&TABLE1[@[RESIDENTIAL_ZIP_CODE]]&"_"&TABLE1[@[RESIDENTIAL_ZIP_PLUS]]&"_"&TABLE1[@[EFFECTIVE_DATE]]&"_"&TABLE1[@[REGISTRATION_DATE]]&"_"&TABLE1[@STATUS]&"_"&TABLE1[@[STATUS_REASON]]&"_"&TABLE1[@PARTY]&"_"&TABLE1[@[MAIL_ADDR1]]&"_"&TABLE1[@[MAIL_ADDR2]]&"_"&TABLE1[@[MAIL_ADDR3]]&"_"&TABLE1[@[MAILING_CITY]]&"_"&TABLE1[@[MAILING_ZIP_CODE]]&"_"&TABLE1[@[MAILING_ZIP_PLUS]]
These HASH were created for snapshots of the El Paso County voter roll over a 16 month period between July 2022 to Nov 2023. Then using each set of HASH per month, the “ADDS” and “DELETES” were identified.
The ADDS are Voter ID HASH combinations that appear in a subsequent month that did not appear in the prior month. Likewise, the DELETES are those HASH that do not appear in a subsequent month that did appear in the prior month. This does not NECESSARILY mean that the Voter ID itself was added or deleted (but it may have been since people do move and die).
The point of this analysis type was to ask the following questions
What % of the voter roll is being “churned on” each month?
Are there voters whose Voter ID are showing up on a high percentage of the periods examined? (Spoiler alert, yes there are). If so why?
Does the churn happening over time on these “high churn” records make sense?Is that a way a human would behave or is it the result of an algorithm manipulating the roll? Fraud? NGO manipulation? All the above?

El Paso County Overview
Let’s set the stage by looking at the following chart. This was a difficult set of data to parse out that required LOTS of data transformation from the raw data set.
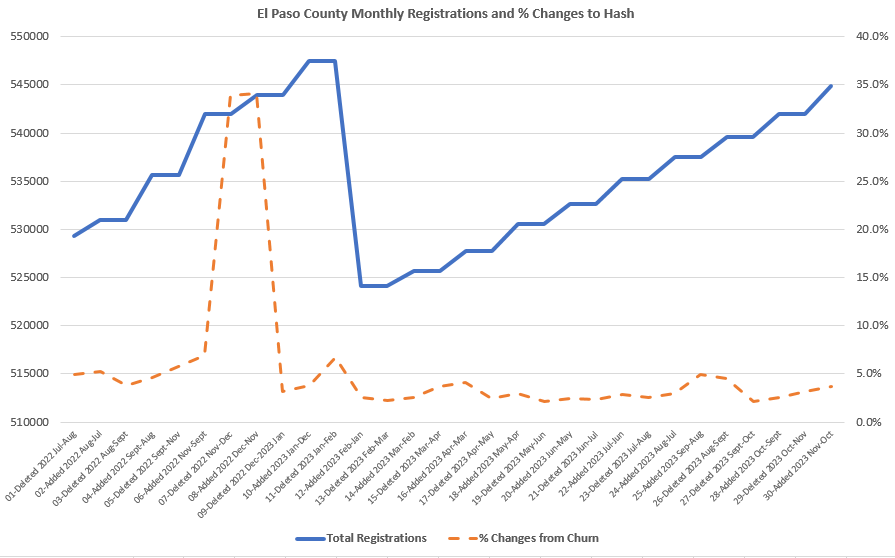
The blue line are the total number of registrants per month from Jul 2022 to Nov 2023 for the snapshot periods. The registrations drive prior to an election and purge after the election is evident and or those of you who have looked at these data before, not a surprise.
The orange line has the real insight however and was the extremely difficult calculation. What this orange line is saying is by reading the y axis on the right is that the typical amount of churn on the roll stays between ~ 3-7% month to month except for those months immediately preceding and after an election.
Maybe even more interesting, as the roll continues to grow (from period 12), the churn rate stays in that 3-7% band (with the exception noted above) which means that the absolute number of records being churned generally goes up with time.
For example, “03-Deleted 2022 Aug-Sept” data is ~4%. This means that ~4% of the roll Voter ID HASH were removed (or deleted) when compared to the prior period.
Now fast forward to “29-Deleted 2023 Oct-Nov” and the churn rate is still 4% but the absolute number of registrations is about 15,000 more at that time.
Further this means one of two things:
The Voter ID was dropped from the roll (they moved out of the county or died, for example)
The meta data associated with that Voter ID changed in some way (the mailing address changed, for example)
The above does not prove FRAUD in anyway (for the trolls).
Here is the point however…..
Doing this analysis does allow you to identify the Voter IDs that are constantly being manipulated and look at the details, on a character by character basis, and ask:
Does this change to the voter record make sense through time?
Are the voter rolls being managed properly?
Is there an audit trail that explains who, what, when, where and why the change was made?
Can I TRUST the management of my county’s voter rolls if 10,000s of records are being update each month and an audit trail does not exist?
Going back to the chart above…..
Starting at period “04” there is a trend up, then a sharp trend up at period “06”, then a sharp trend down at period “08” and a return to a “normal” churn at period “12”.
Let me translate…the high churn rates are occurring during the same periods of time when ballots are being mailed out and immediately after the election. There is no doubt, the proof is right there.
Why then, when we are relying on a mail in ballot system, is the underlying registration database that is used to determine who gets a ballot, in such a state of flux?
Deeper Dive into El Paso County
Looking deeper into the data, there are a total of 364,354 individual voters who had their voter record updated over the course of 16 month between July 2022-Nov 2023 in a county where the registration is about ~530,000. This equates to ~ 23,000 Voters/month having updates made to their record. That is a significant churn that, hopefully, is backed up by an audit trail.
Looking a bit deeper….

This chart is telling you that, for example, by looking at row 6 that there were 11,608 instances of Voter IDs that were changed 6 times over 16 months. Or another one, looking at the line with 15, there were 3 examples of Voters whose records were changed 15 times over 16 months (where “15 times” is the sum of the HASH adds and deletes over that period).
Gee, I wonder what was going on with the folks with say, more than 10 touches on their voter registration records over 16 months? Might be interesting to really break that down….
An Even Deeper Dive
The next set of questions involves looking at each individual vote record and looking at the period to period changes to see what story they tell. Does it make sense? Are good address being used? How did the voter status change through time? How many Returned Ballots were generated or Undeliverable Mail? Are the address being used good? What types of address are they?
In the next article, I will break that down further. Stay tuned.
It seems like this would have to be automated but it is all over the place. Can hardly wait to read the next article! Thank you!
WOW