
The NGO Project Part XVII: New England
The NGO Project Part XVII: New England
CTCL Summary for CT, NH, MA, ME, RI, and VT

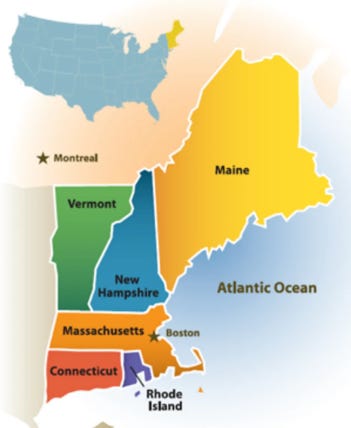
This is an overall summary of all the states in New England.
488 grants in total were made by CTCL to New England totaling ~ $10,100,000. These were spread out amongst 65 of the 67 counties in New England. This means that CTCL grants were made to 97% of the counties in New England. Which counties did not receive grants? Dukes and Nantucket County in MA (aka…. the islands of Nantucket and Martha’s Vineyard).
Of the 65 counties, only 3 of them showed a -2020DIFF value, meaning that despite CTCL grants, the voters shifted more R. They are listed below.

The overall average (not weighted) of 2020DIFF for all of New England is 19%. This yielded 860,000 D votes based on the assumption of this model.
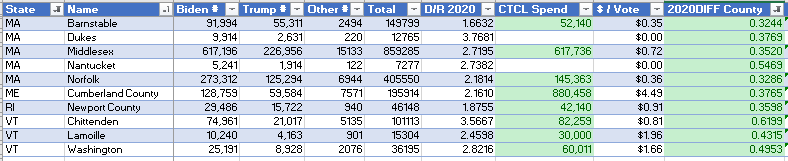
The top 10 counties in terms of $/vote are listed below. 9 of the 10 are in Maine. It ranges from $3.17-$9.95 per vote (all parties).
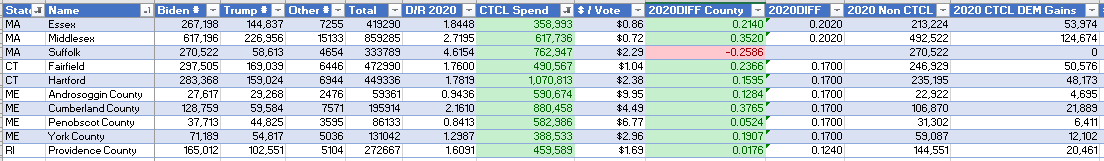
The top 10 counties in terms of +2020DIFF overall for new England are listed below. These are the counties which shifted most to D. The average 2020DIFF for these counties is 42%. CTCL spent 1.9MM in these counties or ~ 20% of all CTCL dollars.
To put it a different way, 20% of the grants were spent on 15% of the counties. In terms of total votes, these 10 counties account for 23% of the total New England votes.
The top 10 counties in terms of CTCL spend are listed below which totals to 6.2MM or ~ 62% of all of the CTCL spend, in 10 counties! This accounts for 31% of the D votes gained due to the CTCL meddling in New England as a whole.
What happened in Suffolk? This is a heavy heavy D county that for some reason still turned out more R in 2020 that shifted the ratio in favor of R’s.
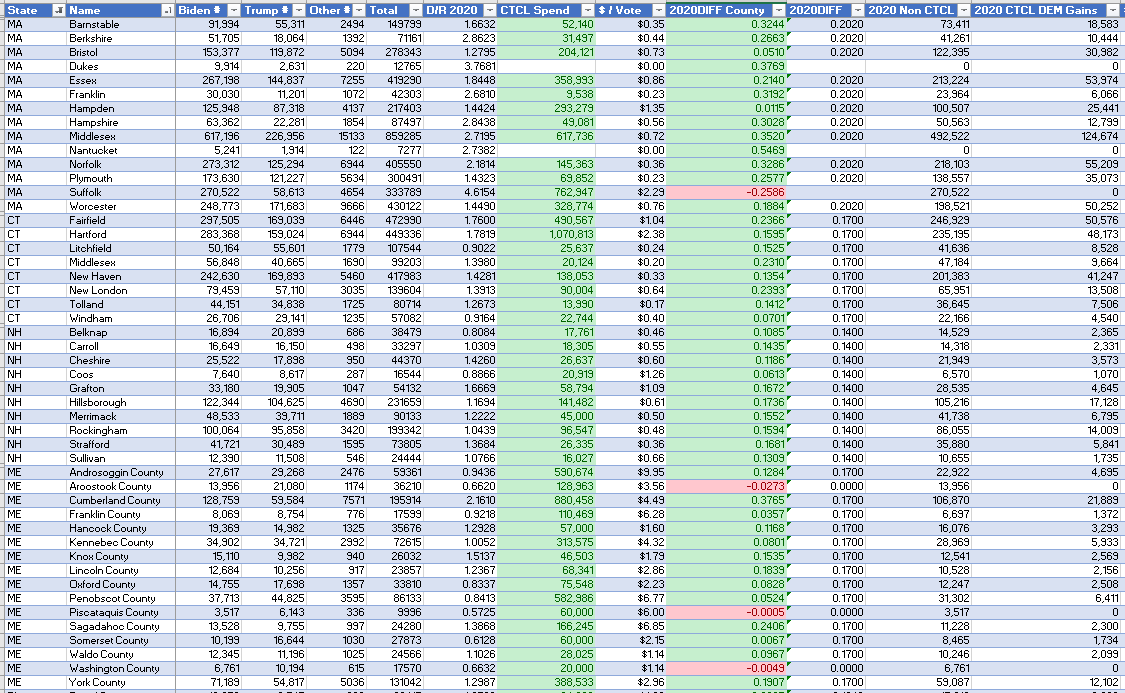
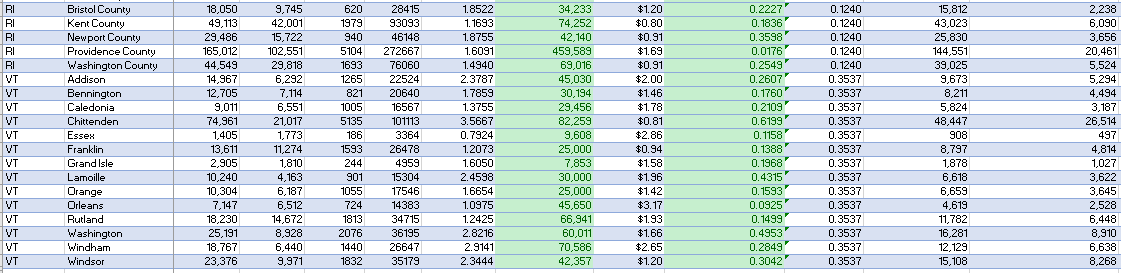
All New England results are summarized below.
The individual state analysis are here.